In a low-level programming language like C, it's the developer's responsibility to allocate and free memory by using standard library functions such as malloc() and free(). On the other hand, many high-level languages provide automatic memory management where the language runtime assumes responsibility for reclaiming memory no longer accessible to the program.
There are many strategies for automatic memory reclamation, but this post will focus specifically on strategies that incorporate a memory management subsystem that runs during program execution. The memory manager implements special algorithms that work in concert to allocate memory and identify/reclaim unreachable memory to be re-allocated.
These algorithms involving identification and reclamation of unreachable memory are collectively called the Garbage Collector (GC). The GC drastically simplifies the life of a programmer by handling program memory lifecycles and helping to ensure the program is free of memory leaks.
There are hundreds of books and papers talking about the different algorithms and possible implementations of GCs. In other words, GCs are a complex subject and they require significant study and research to understand their various aspects. In fact, most of these GC-related topics are outside the scope of this post. For further reading, a good place to start reviewing these concepts is this presentation.
In this post, we'll give a quick overview of the VAST Platform GC implementation and how to tune it for improved performance with your application.
Let's start by classifying the algorithms in the garbage collector (GC) and memory layout. The VAST GC is a generational GC supporting weak object references, and has a special area where objects are guaranteed to not move so they can be used in callouts to C functions. The VAST GC can be logically divided into 3 spaces:
This is the initial default allocation region. Whenever an object allocation occurs (for example, Array new: 3), it will happen in this space by default. This space is divided into 2 memory segments of equal sizes. Each segment is designated either the "active" segment or the "inactive" segment. The "active" segment is where the allocator will allocate an object.
If an allocation is requested with a size that would overflow the active segment, then a copy-collection (aka scavenge) will occur and all "live" objects (those still reachable by the GC) will be copied to the inactive segment, while the "dead" objects (those unreachable by the GC) will be simply left where they are.
After this algorithm completes, the "active" and "inactive" segments switch roles. The new "active" segment contains only "live" objects now. And each object has had their "age" incremented by 1. This scavenging will copy live objects back and forth between the 2 segments until the objects reaches an age that tells the GC it's time to move the object to old space (see below). This age is adaptive and is adjusted after every scavenge based on how full the new "active" segment is afterwards.
The idea of segregating the Smalltalk memory in this way is based on the weak generational hypothesis which states that most objects tend to die young in object-oriented systems like VAST. Furthermore, it was observed that the objects that didn't die young tended to be long-lived. So not only do we want to get rid of short-lived objects quickly, we also don't want to needlessly incur the cost of copying long-lived objects back and forth when scavenges are performed. Of course, long-lived objects that were moved out of new space (these objects are also known as "tenured") will still be subject to a global GC, but at a much slower rate by different algorithms used for these tenured objects in old space.
This is the region where long-lived objects go. In other words, this region contains those objects that survived the necessary amount of scavenges. It is divided into 1 or more old space segments. Usually, you start with one large segment. Additional segments will be dynamically added and removed as the needs of the program increase or decrease.
Scavenges only consider the portion of the Smalltalk memory used for newly allocated objects. But at some point, there may not be any additional old space left to move tenured objects to. At this point, a "global garbage collection" is initiated, which in VAST runs the Mark/Sweep and Compactor algorithms.
Mark/Sweep will first "mark" all "live" objects, and then perform a complete memory sweep. Doing so pokes holes (like swiss cheese) in memory which leads to poor CPU cache locality during object access patterns. It also makes allocation much more expensive and complex since we now need to keep track of the size of memory holes and try to fill them.
To solve such allocation issue, we instead run a compactor that works a lot like Windows' disk defrag. It slides objects over to fill in the holes giving good cache locality and making the allocator's job really simple since it can just allocate at the end of memory.
Most GC algorithms in VAST will move objects around in memory, but fixed space is the region where objects will go that should NOT move. It can grow in size dynamically and is most often used when referencing Smalltalk memory from external C functions. Fixed space exists so Smalltalk object references to a long running C function are protected from garbage collections that may consequently invalidate memory references and cause other undefined (and most likely fatal) behavior.
There isn't a one-size-fits-all approach to the GC memory settings that will boost the performance of all applications. That's why VAST provides a way for you to customize different aspects of the memory manager so you find the settings that work best for your applications. This is commonly known as GC tuning and is often application dependent.
With GC tuning, the general goal is to make the percentage of time spent garbage collecting as small as possible. This should be balanced against the length of execution pauses (caused by garbage collection) to best complement your type of application.
How do you know if the GC is being stressed when running your application? You need to measure!
Now... let's say you measured it and indeed your application is spending too much time in the GC and you would like to speed it up. Once you start tuning the GC and experimenting with the different memory settings, how do you know your new custom GC settings are having the desired effect? You need to measure again!
As you can see, measuring is key. It's the only way you have to find your magic recipe.
A user could just change the settings and measure the performance of their system. However, VAST can provide even more insights. For example, you can query how many global garbage collects and scavenges have occurred since VAST started and how long they took. Example:
 | vmStatsOffset ptr |
vmStatsOffset := System is64BitVM ifTrue: [24] ifFalse: [12].
ptr := OSPtr address: (Processor activeProcess globalInfoPointer pointerAt: vmStatsOffset).
Transcript
	show: 'millisecondGlobalGCTime: ', (ptr uint32At: 20) printString; cr;
	show: 'numberOfGlobalGCs: ', (ptr uint32At: 12) printString; cr;
	show: 'timeForLastGlobalGC: ', (ptr uint32At: 28) printString; cr;
	show: 'millisecondScavengeTime: ',  (ptr uint32At: 16) printString; cr;
	show: 'numberOfScavenges: ', (ptr uint32At: 8) printString; cr;
	show: 'timeForLastScavenge: ', (ptr uint32At: 24) printString; cr.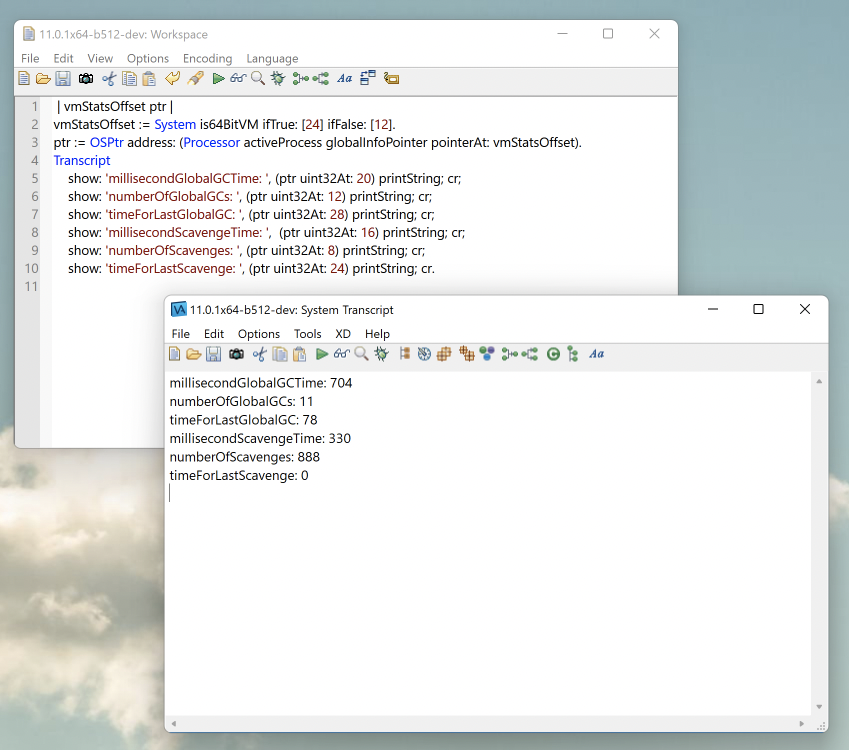
In this example, it means that there were 11 global garbage collects since VAST started, all of them accumulating 704 ms, while the last one took 78 ms. The same conclusions can be taken from the scavenges. It is a good idea to run your system for a while and then query this information.
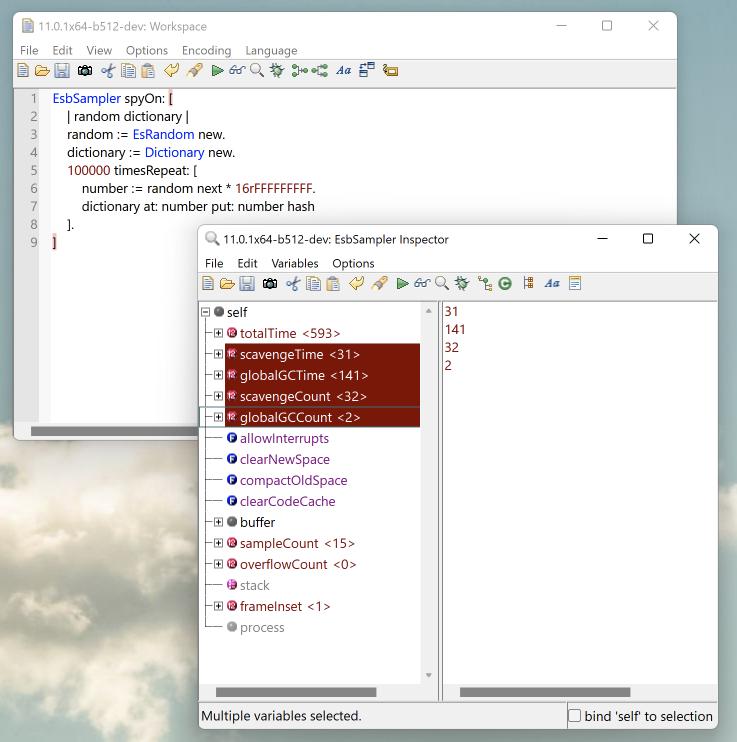
Another common case is when you have a piece of code that you want to profile instead of the whole application. In this case, you can use the EsbSampler (included in the feature "ST: Performance Workbench") to grab GC information specifically for that snippet of code. Example:
EsbSampler spyOn: [
	| random dictionary |
	random := EsRandom new.
	dictionary := Dictionary new.
	100000 timesRepeat: [
		number := random next * 16rFFFFFFFFF.
		dictionary at: number put: number hash
	].
] 
Other useful information to query is the availability and status of the Smalltalk memory. Example:
Transcript
	show: 'Total allocated bytes: ' , System totalAllocatedMemory printString; cr;
	show: 'Available (new space + old space) bytes: ' , System availableMemory printString; cr;
	show: 'Available new space bytes: ' , System availableNewSpaceMemory printString; cr;
	show: 'Available old space bytes: ' , System availableOldSpaceMemory printString; cr;
show: 'Available fixed space bytes: ' , System availableFixedSpaceMemory printString; cr. 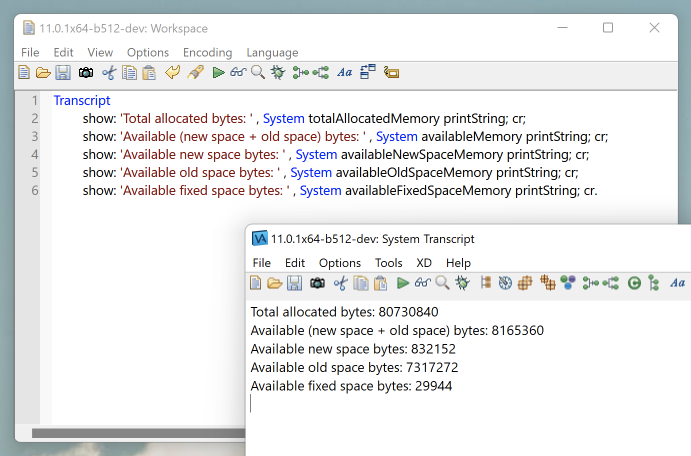
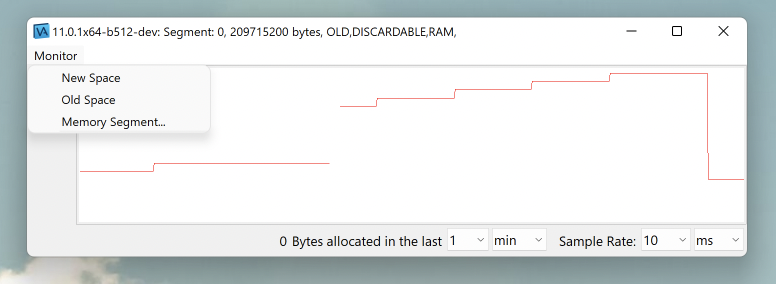
However, sometimes you don't want a static picture of the memory status or the GC stats but rather a series of values that can be plotted on a chart. For this, we have customers that use a Smalltalk background job that runs every X time (similar to a "cron job") and logs this information into files. Then they use some chart technology to read those logs and provide nice charts.
In addition, VAST has it's own memory chart that can display the status of the new space and the old space. Again, after loading the VAST feature "ST: Performance Workbench", go to Transcript -> Tools -> Open Memory Monitor.
Finally, now that we know how to measure it, it's time to tune it.
The following memory settings can be specified either in the VAST .ini file or via command line arguments when starting VAST. For simplicity, in this post, we will use the .ini file option.
As we said earlier, there is no silver bullet for GC settings. However, we have found that if there is one thing in particular that tends to make the biggest impact, it is the oldSpaceSize in the .ini file.
Instead of starting your experiments with a random number, we recommend you do some profiling to understand the baseline memory requirement of your application over time. In Windows, the simplest way (but not necessary the most accurate) is by checking the memory used by the process in the task manager. While there are other more exact ways of measuring that, this is out of scope for this post.
For example, if your application over time uses about 200MB of memory, then go ahead and make old spaceSize=209715200 (in bytes) or bigger in the .ini file (be sure the line is not commented out).
We also recommend, at the very least, to use the Smalltalk image size as the oldSpaceSize. For example, if your image is 200MB, then we would put at least 200MB in old space.
You may be wondering... what if I have plenty of RAM available and I want to make old space as large as possible? If you have 2GB of available memory... then preallocate it and use it (oldSpaceSize=2000000000). This is mostly favorable because you're going to delay a full garbage collection way out into the future. On the other hand, when you do finally have to do a garbage collection, it's going to have a longer pause associated with it. If you're willing to accept a 2 second pause (or whatever it takes for a global garbage collection) at some point, then it should be fine. As you can imagine, it is application dependent. 🙂
We can then also evaluate the newSpaceSize. Every application is different, but in general, it doesn't do any good to make new space something huge like 50MB. You begin to run into 2 issues:
Of course, CPU caches are typically shared resources and you can't really pin your new space to a CPU cache. So, this is not an exact science. However, the point here is to take advantage of the principal of locality. You want the data you’re working with as close to the CPU as possible. And that's one of the benefits of having a segregated new space in the first place. It’s short lived, immediate data and everything else should be moved out of the way. But this needs to be balanced with not making the new space too big for the reasons discussed regarding paging and delayed-tenuring of long-lived objects. As stated before, make small changes and measure the results, like all tuning activities.
Usually this setting is set to a small divisor (less than 10) of your steady-state oldSpaceSize.
This setting sets the minimum size of free object memory after a garbage collection. A good suggested value is to be half of the allocationIncrement.
While there aren't particular settings that would be ideal for all potential applications, this is our recommended starting point for analysis:
newSpaceSize=ideally half of the largest of the CPU caches and if unknown, leave the default 2MB
oldSpaceSize=your baseline memory requirement of your application as it runs for awhile
allocationIncrement=oldSpaceSize/10
lowMinimum=allocationIncrement/2Every once in a while, we have customers comparing the performance of VAST x86 against VAST x64.
While 64-bit CPU instructions for things like floating point math and various other pieces of code where the lack of CPU registers on x86 were holding it back… it’s more common to expect a performance hit in 64-bit because there is a lot more memory being shuffled around the memory subsystems of the machine.
For example, in VAST x64, each object header is 4 bytes larger, and each pointer slot is twice as big than on VAST x86. It’s obviously hard to measure, but you can typically expect around a 10% hit in performance when comparing VAST x64 with VAST x86. But if you're hitting the process memory limits on x86, which basically results in the GC running non-stop, then you can expect x64 to be many factors faster. Once again, it depends on your application. Measure!
Given the state of the industry, processors, and external shared libraries at the time of writing (2022), moving to x64 should be in your shorter-term transition plan anyway for many functional and non-functional reasons.
Tuning a GC is not an easy task, and it all depends on your application. The best way to accomplish this to make small changes and measure the results, and with VAST, we give you tools to help with that process. If something was unclear or if you have questions, don't hesitate to contact support or start a discussion in the VAST Community Forum.