Testing server applications : Debugging Smalltalk errors : Using the stack dump debugger : Viewing a stack dump in Smalltalk

Viewing a stack dump in Smalltalk
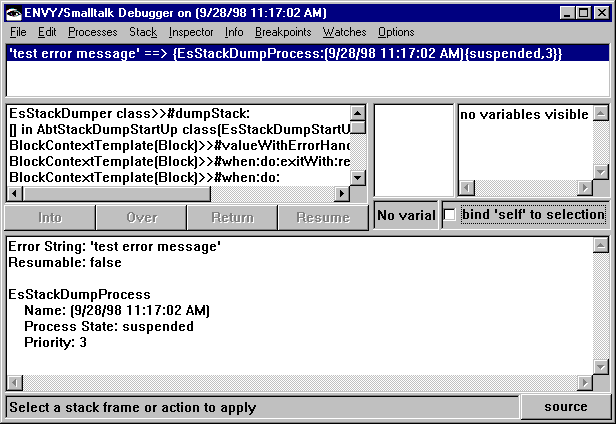
You can view a stack dump on the workstation using the Smalltalk stack dump debugger. The stack dump debugger is a simplified version of the Smalltalk workstation debugger.
Use the stack dump debugger to investigate the state of your image at the point of error. You cannot use it to alter the state of objects within that image. The process control buttons--Into, Over, Return, and Resume--are not available. All menu items pertaining to code evaluation, such as Execute and Display, are also not available.
To view a stack dump using the stack dump debugger, do the following:
1.
From the Tools menu of the System Transcript window, select Open Debugger.
2.
From the Processes menu of the debugger, select Add Stack Trace.
3.
UNIX iconViewing stack dump files generated on differing UNIX platforms
When your development image is running on UNIX, you will not be able to read stack dump files that were generated on an architecture with different endian-ness. Doing so will cause a walkback.
 
Stack dump
You can view the source code provided the snapshot and the corresponding manager library have not changed and the development image is connected to the library. If the snapshot has been lost or if the library is not the same, the stack dump debugger works, but the method source is not displayed. Follow the steps for saving the snapshot described in Packaging a Smalltalk image.
When using the stack dump debugger to browse a method that has been replaced by another method during packaging, the debugger will display the source for the original method, not the replacement method.
The qualifier <Dumped> in the printed representation of an object serves as a reminder that the object is not active within the development image; a <dumped> object is a representation of the object that existed at the time of the Smalltalk error on the target platform.
Accessing variables with the stack dump debugger
Note that although variables cannot be changed within the stack dump debugger, they can be inspected. You can access the following variables with the stack dump debugger:
Accessing global variables
To access the Smalltalk dictionary from the stack dump debugger, do the following:
1.
2.
Select the self pseudo variable and inspect it.
3.
Accessing pool variables
To access a pool variable used by a particular pool dictionary, do the following:
1.
2.
Accessing class variables
To access a class variable from a particular class, do the following:
1.
2.
In the class inspector, select the classPool variable and inspect it.
3.
Accessing class instance variables
To access a class instance variable from a particular class, do the following:
1.
2.