Opening a debugger and examining its contents
You can open a debugger by selecting Open Debugger from the Tools menu. The window that opens contains five empty panes.
You can display information on a coding error in the panes by selecting Debug Other from the Processes menu. Then, if your system is storing information on previous coding errors, select one of the listed error reports.
Or, display information on coding errors by executing flawed code. For example, evaluate the following expression in a Workspace window with the Execute command:
(OrderedCollection new)
at: 4 put: 'Sam'
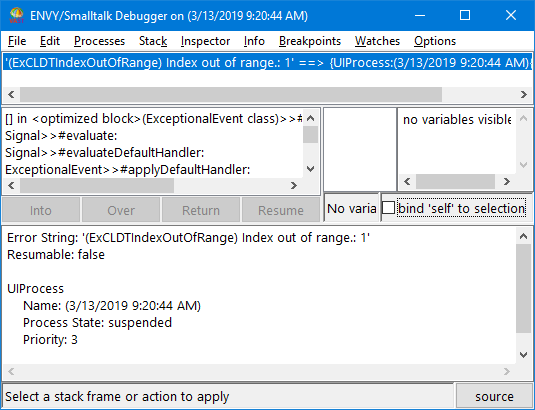
The debugger displays the following:


Notice the error message in the upper left pane. The message '(ExCLDTIndexOutOfRange) Index out of range' pinpoints the event that triggered the debugger.
The four other panes in the debugger provide related information:
Message stack
Just below the error message is the message stack, which lists the messages (or methods) that were executing when the debugger opened. In this example, the first few messages include:
[] in <optimized block>(ExceptionalEvent class)>>#initializeSystemExceptions
Signal>>#evaluate:
Signal>>#evaluateDefaultHandler:
ExceptionalEvent>>#applyDefaultHandler:
ExceptionalEvent>>#signalFor:
ExceptionalEvent>>#signalWithArguments:
ExceptionalEvent>>#signalWith:
OrderedCollection>>#at:put:
UndefinedObject>>#Doit
Methods are shown using the system's format for methods: class>>#method. The # character precedes method names because method names are symbols in VA Smalltalk. ] in at the beginning of an entry indicates that a block of code in the method was executed. The word class after a class name indicates that the method is a class method; methods not having the word class are instance methods.
The message stack shows the most recently sent message at the top of the list, and the first message sent at the bottom of the list. The message stack includes messages sent by your code and messages sent by the system.
Description pane
When you select a method from the message stack, the code for that method is shown in the description pane (the bottom pane). The expression sent is highlighted. Note that a method in the highlighted expression points to the entry just above the selected method. In the example, if you click on ExceptionalEvent>>#applyDefaultHandler:, the method evaluate: is shown in the highlighted expression. The entry just above ExceptionalEvent>>#applyDefaultHandler: in the message stack is Signal>>#evaluate:.
List of variables
To the right of the error message and message stack is a list of variables, which functions like the list of variables in an Inspector window. It names the object that received the selected message and any temporary variables of the selected message. By double-clicking on a variable (or by selecting Inspect or Basic Inspect from a pop-up menu), you can open an inspector on the variable.
Value pane
The value pane displays the value of a selected variable at the time the error occurred. As with the list of variables, the value pane functions like the value pane in an Inspector window.
The preceding chapter, Inspecting objects, provides information that can help you interpret the contents of the last two panes.
Last modified date: 10/01/2019