The Debugger
The debugger allows you to enables you to look at live objects midway in the execution path. A debugger will open if executing Smalltalk code results in errors.

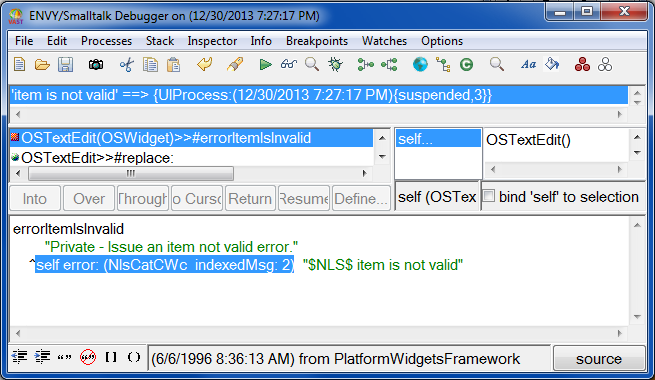
The top pane explains the reason the debugger has opened. Here there is an error with the item I the text widget. The middle three panes (left to right) specify the execution stack, the objects available in the selected method of the stack and the object selected. The bottom pane shows the method selected in the execution stack. You can examine code as well as live objects to determine the reason for failure. In many situations you can even change either code or object and continue execution.
Last modified date: 03/26/2020